Latest Property News
- Details
- Hits: 1163
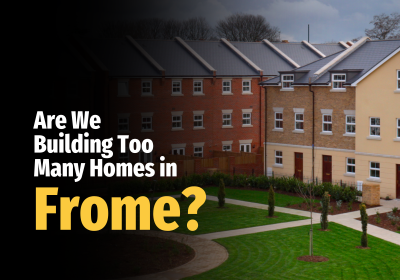
Are We Building Too Many Homes in Frome?
The issue of new housebuilding in the UK stirs strong emotions. Many believe their local areas are turning into construction zones, with too many homes being built, disrupting the character of towns and villages.
But is this perception grounded in reality?
The Labour government, which came into power in the summer of 2024, has set a bold target: 300,000 homes built annually for the next five years, amounting to 1.5 million new homes by the end of their tenure. This figure sounds ambitious - and perhaps a touch optimistic - when you consider that, as a nation, we've averaged only 170,000 to 180,000 homes per year over the last two decades.
- Details
- Hits: 1025
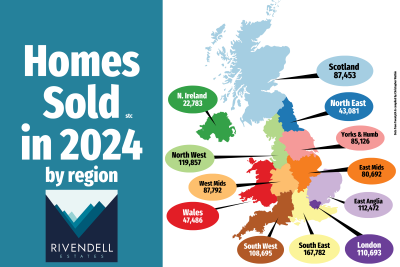
UK Regional Property Market Update: Homes Sold in 2024
The UK property market in 2024 has seen fascinating regional variations in the number of homes sold. With over 1 million homes sold across the country, understanding these differences offers valuable insights into market activity.
The broader picture of the UK’s different regions shows a diverse and dynamic market.
- Details
- Hits: 802
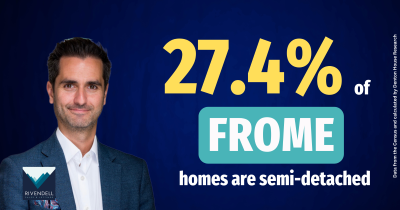
% of homes that are Semi-Detached
With 27.4% of homes in Frome being semi-detached, this property type has long been a staple of most British towns and cities. Across the UK, the proportion of semi-detached properties varies significantly by region:
- Details
- Hits: 862
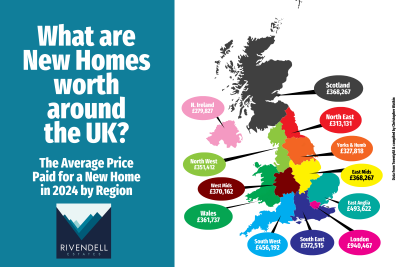
New Home Prices 2024 by Region
The UK property market continues to showcase the significant role new homes play, contributing to nearly one in every five house sales annually.
In 2024, the average price paid for a new home across the UK was £505,978, reflecting a strong demand for modern, energy-efficient properties.
- Details
- Hits: 929

£ per square foot December 2024
Welcome back to news of Frome's property market, where each week I bring you different local property market stats and trends. This week I am back again with the December's £/sq.ft statistics.
The average property presently in Frome is on the market for £348 per square foot, a figure representing the current heartbeat of Frome's property market.
Last month it was £358 per square foot.


