Latest Property News
- Details
- Hits: 729
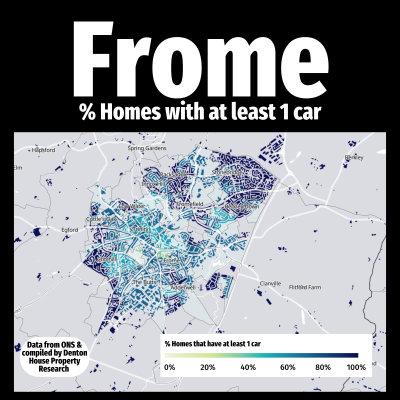
% of homes with at least one car
Parking isn't just a convenience anymore. In towns like Frome, the number of homes with access to at least one car paints a revealing picture of how we live, move, and plan our lives.
The data highlights how car ownership is the norm in most neighbourhoods, with many households relying on private transport for work, school, shopping and day-to-day life.
- Details
- Hits: 859

Frome House Price Review: The June 2025 Update
Frome homeowner or landlord? Curious about the trends in the Frome property market? One measure is the average price paid for homes bought and sold in Frome in the last 12 months, on a rolling month by month basis.
Each month I like to share this figure, and whilst this figure alone will not tell you much, its trend will. My followers on social media know I write regular articles on the Frome property market. It is in those articles I expand and clarify what these monthly figures mean to you.
- Details
- Hits: 790
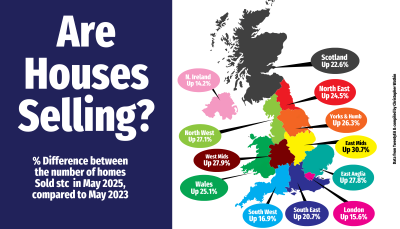
Regional Update on the Property Market : 2025 vs 2023
In May 2025, 121,665 homes were sold subject to contract across the UK. That’s 6.3% more than May 2024, and a massive 23.4% jump compared to May 2023 when only 98,609 homes sold.
Zooming in by region, the market uplift is visible everywhere. Here are the regions listed in order of the highest to lowest increase in the number of homes sold (subject to contract) in May 2025 compared to May 2023:
- Details
- Hits: 1339
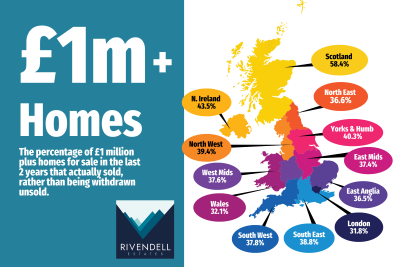
How Many £1 Million Homes Actually Sell?
It surprises many people just how few £1 million homes actually sell. Just because a property carries a seven-figure price tag, it does not guarantee a successful move.
Nationally, across all property price bands, around 54 percent of homes sell and complete. Yet for homes priced over £1 million, the picture changes sharply.
Over the last two years, the highest success rate has been in Scotland, where 58.4 percent of £1 million homes successfully sold. This is partly due to the different legal system in Scotland, where transactions tend to be more certain once agreed.
- Details
- Hits: 833
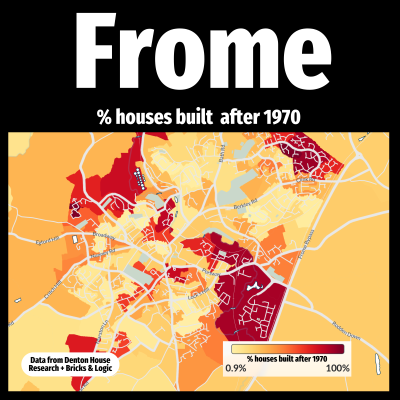
% of Houses Built After 1970
Frome's property market tells a fascinating story when you break it down by the age of housing stock. The map shows the percentage of homes built after 1970, giving real insight into the town’s development patterns over the past fifty years.
The grey areas represent neighbourhoods where no new homes have been built since 1970, often comprising older, more established properties with period charm and character. In contrast, the lighter yellow and orange shades highlight parts of Frome where some new housing has emerged, but growth has been more modest.


